

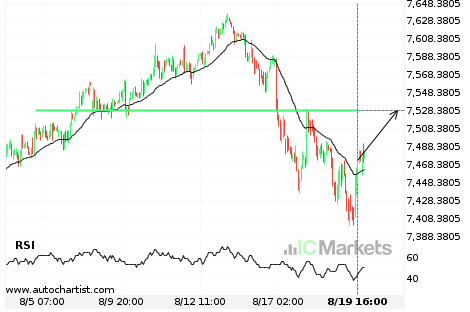
Breach of important price line imminent by Australia 200 Index
Australia 200 Index is moving towards a line of 7528.6602 which it has tested numerous times in the past. We have seen it retrace from this positions in the past, so at this stage it isn’t clear whether it will breach this price or rebound as it did before. If Australia 200 Index continues in […]
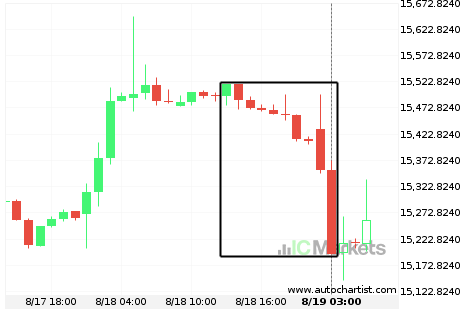
What’s going on with FTSE China A50 Index?
Those of you that are trend followers are probably eagerly watching FTSE China A50 Index to see if its latest 2.08% move continues. If not, the mean-reversion people out there will be delighted to cash in on this exceptionally large 14 hours move.

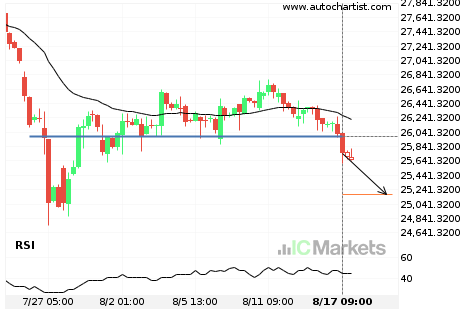
A start of a bearish trend on Hong Kong 50 Index
Hong Kong 50 Index has broken through a line of 25982.0000. If this breakout holds true, we expect the price of Hong Kong 50 Index to test 25177.8691 within the next 3 days. But don’t be so quick to trade, it has tested this line numerous times in the past, so you should probably confirmation […]
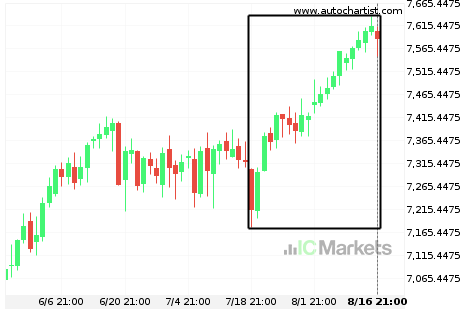
Australia 200 Index experienced an exceptionally large movement
For those of you that don’t believe in trends, this may be an opportunity to take advantage of an exceptional 5.17% move on Australia 200 Index. The movement has happened over the last 30 days. For those trend followers among you, you may think about riding this trend.

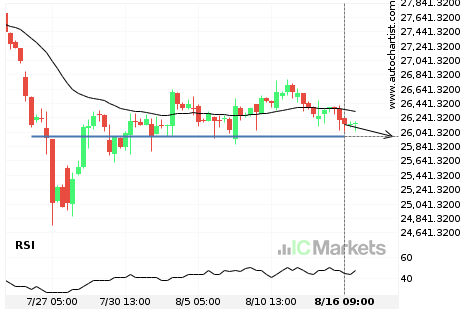
Either a rebound or a breakout imminent on Hong Kong 50 Index
Hong Kong 50 Index is heading towards a line of 25982.0000. If this movement continues, we expect the price of Hong Kong 50 Index to test 25982.0000 within the next 3 days. But don’t be so quick to trade, it has tested this line numerous times in the past, so this movement could be short-lived […]
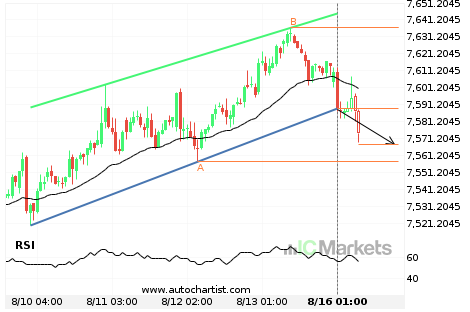
A start of a bearish trend on Australia 200 Index
Australia 200 Index has broken through a support line of a Channel Up chart pattern. If this breakout holds true, we expect the price of Australia 200 Index to test 7567.9418 within the next 23 hours. But don’t be so quick to trade, it has tested this line in the past, so you should probably […]
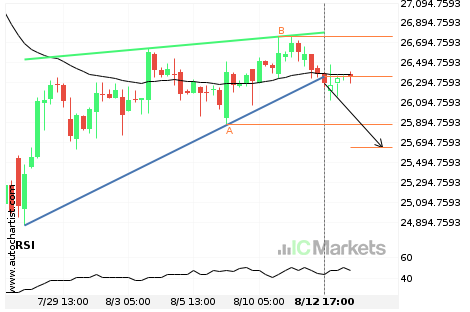
A start of a bearish trend on Hong Kong 50 Index
Hong Kong 50 Index has broken through a support line of a Rising Wedge chart pattern. If this breakout holds true, we expect the price of Hong Kong 50 Index to test 25643.0477 within the next 2 days. But don’t be so quick to trade, it has tested this line in the past, so you […]